|
<< Click to Display Table of Contents >> Shaped Layer Interfaces |
  
|
|
<< Click to Display Table of Contents >> Shaped Layer Interfaces |
|
We have stated that the layer interfaces need not be planar. But FlexPDE makes some assumptions about the layer interfaces, which places some restrictions on the possible figures.
| • | Figures must maintain an extruded shape, with sidewalls and layer interfaces (the sidewalls cannot grow or shrink) |
| • | Layer interface surfaces must be continuous across region boundaries. If a surface has a vertical jump, it must be divided into layers, with a region interface at the jump boundary and a layer spanning the jump. (Not this: |
| • | Layer interface surfaces may merge, but may not invert. Use a MAX or MIN function in the surface definition to block inversion. |
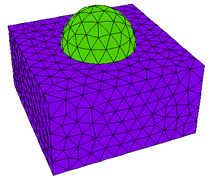
Using these rules, we can convert the canister of our example into a sphere by placing spherical caps on the cylinder.
The equation of a spherical end cap is
Z = Zcenter + sqrt( R^2 – x^2 – y^2)
Or,
Z = Ztop – R + sqrt(R^2 – x^2 – y^2)
| • | To avoid grazing contact of this new sphere with the top and bottom of our former box, we will extend the extrusion from –1 to 1. |
| • | To avoid arithmetic errors, we will prevent negative arguments of the sqrt. |
Our modified script now looks like this:
TITLE 'Heat flow around an Insulating Sphere'
COORDINATES
Cartesian3
VARIABLES
Phi { the temperature }
DEFINITIONS
K = 1 { default conductivity }
R = 0.5 { sphere radius }
{ shape of hemispherical cap: }
Zsphere = sqrt(max(R^2-x^2-y^2,0))
EQUATIONS
Div(-k*grad(phi)) = 0
EXTRUSION
SURFACE 'Bottom' z=-1
LAYER 'underneath'
SURFACE 'Sphere Bottom' z = -max(Zsphere,0)
LAYER 'Can'
SURFACE 'Sphere Top' z = max(Zsphere,0)
LAYER 'above'
SURFACE 'Top' z=1
BOUNDARIES
REGION 1 'box'
START(-1,-1)
VALUE(Phi)=0 LINE TO (1,-1)
NATURAL(Phi)=0 LINE TO (1,1)
VALUE(Phi)=1 LINE TO (-1,1)
NATURAL(Phi)=0 LINE TO CLOSE
LIMITED REGION 2 'blob' { the embedded blob }
LAYER 2 K = 0.001
START 'ring' (RSphere,0)
ARC(CENTER=0,0) ANGLE=360
TO CLOSE
PLOTS
GRID(y,z) on x=0
CONTOUR(Phi) on x=0
VECTOR(-k*grad(Phi)) on x=0
ELEVATION(Phi) FROM (0,-1,0) to (0,1,0)
END
Cut-away and cross-section images of the LAYER x REGION compartment structure of this layout looks like this:

The contour plot looks like this:

Notice that because of the symmetry of the 3D figure, this plot looks like a rotation of the 2D contour plot in "Putting It All Together".